Throughout the Earth’s geological history, climate has changed as a result of natural processes: changes in the planet’s orbital parameters, changes in the composition of the atmosphere, the drift of tectonic plates, cycles of solar activity and volcanic eruptions. Climate change over the last 200 years is notable for the fact that the main cause of change human activity Since the onset of industrialisation, humans have begun to change the chemical composition of the atmosphere, exacerbating the greenhouse effect in the Earth’s atmosphere. Various gases emitted by transport, industry and agriculture accumulate in the atmosphere. Anthropogenic gases in the atmosphere let the Sun’s rays through, but trap heat from the Earth’s surface. Under natural conditions, this heat would be radiated into space. The increase in greenhouse gases is the result of reckless actions by mankind: deforestation, urbanisation, extensive and intensive agricultural development. Deforestation and changes to the Earth’s surface upset the balance of oxygen and carbon dioxide in the atmosphere and change the Earth’s albedo. Continued growth in industry, agriculture and transport is contributing more and more greenhouse gases to the atmosphere.
Climate change impacts include rapid ocean level rise, changes in vegetation, intensification of droughts, changes in rainfall patterns, and more frequent river flooding. There are also more extreme events tropical cyclones, tornadoes, torrential rains, hurricanes, heat waves, etc.
In Lithuania, observations of air temperature in Vilnius date back to 1770. More than 240 years of measurements make it possible to assess natural and man-made climate variations. The rise in mean annual temperature has been very pronounced over the last 30 years (Figure 1).
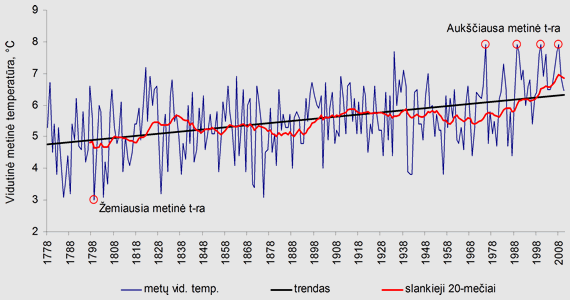
Compared to the beginning of the 20th century, the average annual temperature in Lithuania rose by 0.7-0.9 °C. Although Lithuania is located in a zone of over-irrigation, summer droughts are becoming more frequent (1992, 1994, 2002, 2006). The amount of precipitation on the territory of Lithuania varies unevenly – in some places precipitation is decreasing, in others it is increasing (but these changes are not very large). The trend in Lithuania is one of increasing precipitation in the cold season and decreasing in the warm season. Liquid precipitation is an increasingly important component of cold-weather precipitation.
Climate projections for the 21st century are based on numerical models. As the climate is increasingly influenced by human activities, climate change projections are based on socio-economic scenarios. They take into account human population growth, economic development and associated greenhouse gas emissions.
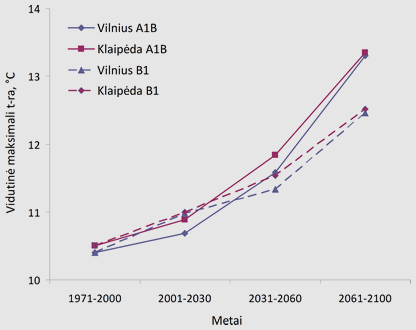
COSMO CLM and HadCM3 and ECHAM5 climate model outputs have been used in climate change research and forecasting in Lithuania at Vilnius University. Based on the modelling results, average maximum and minimum air temperatures in Lithuania are projected to increase over the 21st century. The biggest changes are expected during the cold season. Average maximum and average minimum temperatures in Vilnius up to 2100 m. can rise by 4 °C (Fig. 2) and in some months by 7 °C
Heatwaves (with maximum temperatures ≥ 30 °C) will become more frequent in the 21st century. Such heatwaves in period of 2061-2100. will be 7 days more than in 1971-2000. In coastal areas, such dangerous events will be less frequent, with an increase of only 1-2 days per year. The hottest days will occur in July. Periods of cold days are expected to become less frequent in the future, with the biggest changes expected in January. Climate models predict that by the end of the 21st century, cold spells (with minimum temperatures ≤ -15 °C) will be confined to January-February and will last from 2061-2100. will not exceed 2 days per year in Vilnius and 1 day in Klaipėda.
In the 21st century, the duration of solar radiation will increase in August-October and decrease throughout the rest of the year. The decrease in sunshine duration is mainly due to increased cloud cover caused by active cyclonic activity during the cold season.
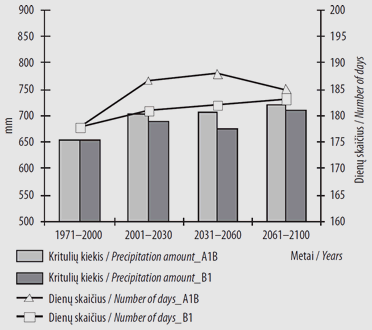
According to the results of research conducted by Lithuanian scientists, the biggest changes during the 21st century in precipitation are expected in winter, while summer precipitation is expected to change little. Klaipėda will receive twice as much precipitation, with 123-163 mm (16-22%) more than at the end of the 21st century. Meanwhile, the change in Vilnius will be 57-65 mm (or 9-10%). The highest increase (>30%) will be in the coastal areas and the Samogitian highlands.
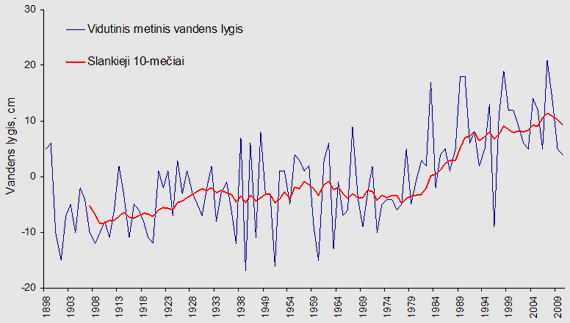
Changing temperatures and precipitation will affect all sectors of the economy, including tourism. The Seaside is one of the most vulnerable regions in Lithuania to climate change. Lithuania’s coastline belongs to the south-eastern Baltic region, which will experience the biggest changes in the 21st century as a result of land subsidence and sea-level rise. Pessimistic projections suggest that the Baltic Sea level in this region could rise by up to 0.5-1.0 metres. A 1 m rise in the water level would put Klaipėda and Palanga at risk of flooding. More frequent storm surge could disrupt the operation of the Port of Klaipėda. Therefore, to avoid negative impacts, existing engineering networks need to adapt to future changes.
Climate change can have severe consequences and adaptation measures are needed. Daily monitoring and forecasting of meteorological and hydrological phenomena is essential to reduce the negative impacts of extreme weather events and to provide timely warnings to the population of potential hazards. Environmental monitoring and technical adaptation measures must go hand in hand with social change, so that society is able to adapt and take responsibility for the changes taking place.
References:
- Galvonaitė A. ir kt. (2007). Lietuvos Klimatas. LHMT, p. 207.
- The Oxford Dictionary of Wheather (2009). Oxford University Press.
- Rimkus E., Kažys J., Junevičiūtė J., Stonevičius E. 2007. Lietuvos klimato pokyčių XXI amžiuje prognozė, Geografija 43(2): 37–47.
- Margelytė S. (2011). Lietuvos klimato prognozė XXI amžiui remiantis COSMO–CLM modeliu. Magistro darbas, darbo vadovas doc. E. Rimkus, p. 70.
- Rimkus E., Kažys J., Bukantis A. 2009. Gausių kritulių Lietuvoje prognozė XXI amžiui pagal regioninį CCLM modelį, Geografija 45(2): 122–130.
- Meier H.E.M., Broman B., Kjellström E. (2004). Simulated sea level in past and future climates of the Baltic Sea. Climate research 27: 59–75.
- Bukantis A. ir kt. (2007). Klimato kaita: prisitaikymas prie jos poveikio Lietuvos pajūryje. VU leidykla, p. 108.
- Aplinkos apsaugos agentūros Jūrinių tyrimų departamento duomenis, 2011.